
Ecommerce Development
08 min read
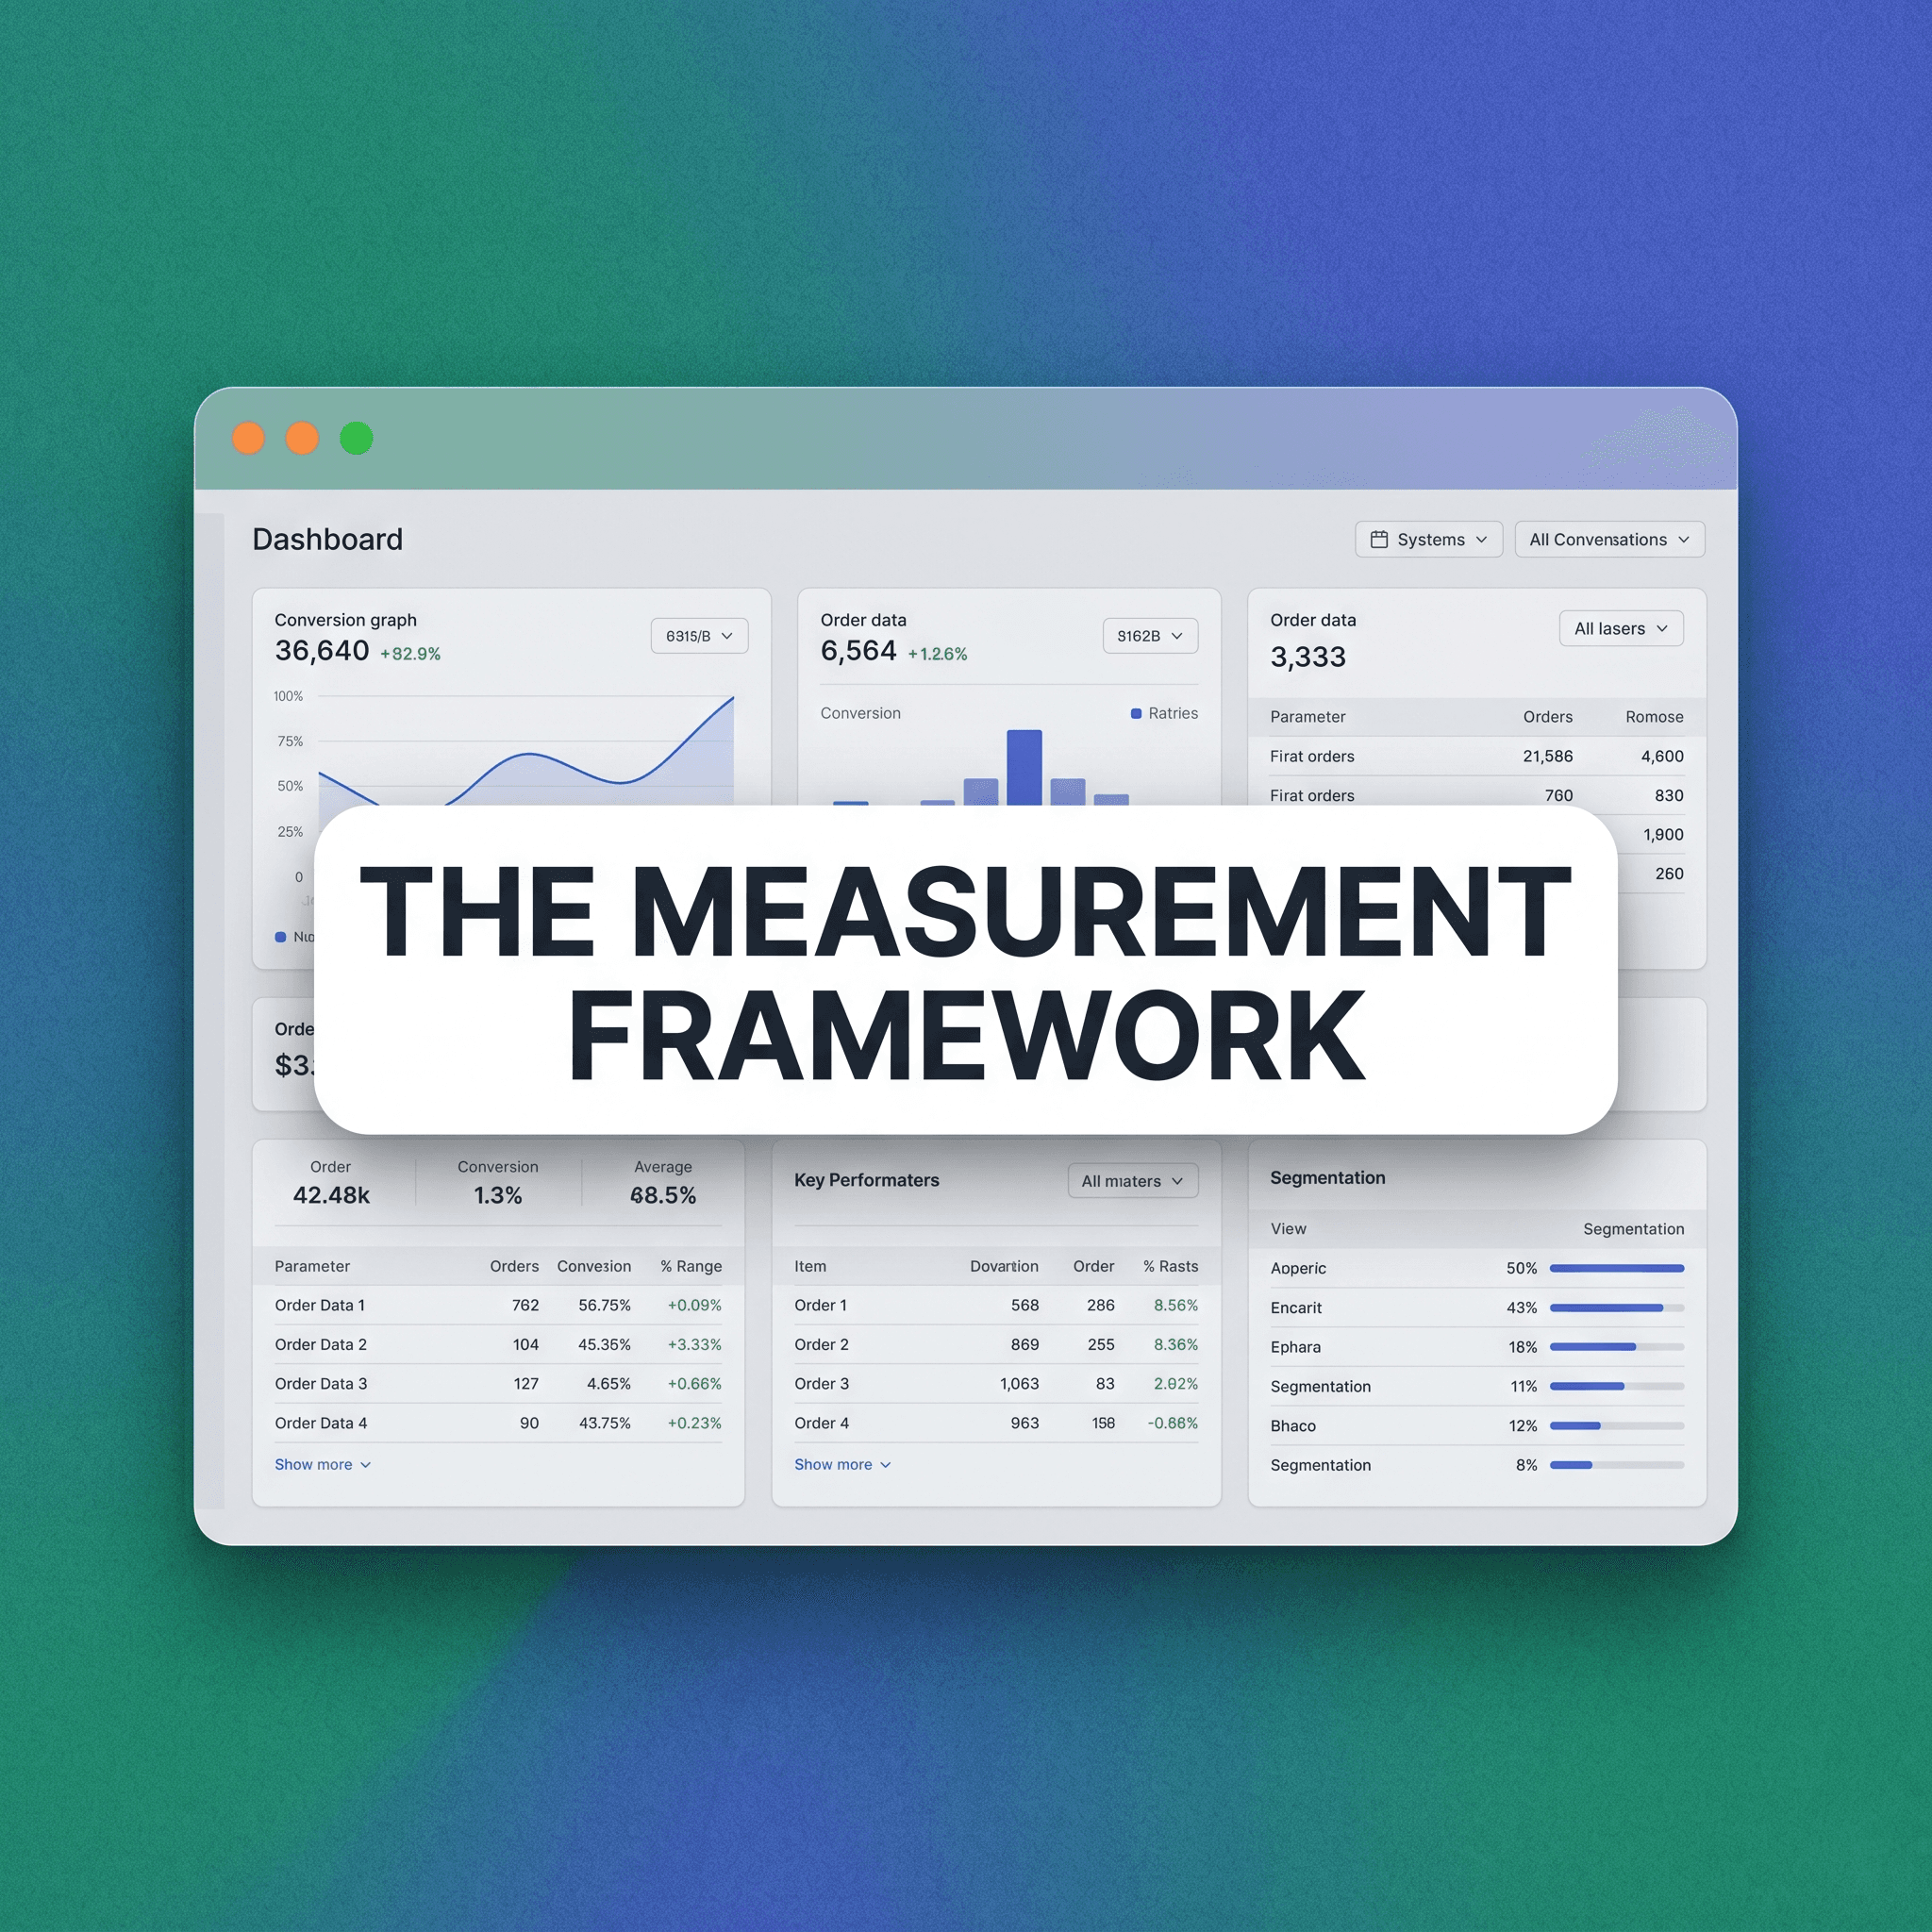
A useful Shopify analytics dashboard is not one screen containing every available metric. It is a governed set of views that answers specific commercial questions using agreed definitions and reconciled sources. Shopify should usually own order and store-operating facts, finance should own recognised financial results, behavioural analytics should explain journeys, and advertising platforms should provide delivery evidence.
Start with decisions: whether to change acquisition spend, fix conversion, adjust merchandising, reorder inventory, improve retention or investigate margin. Define each metric, source, time basis, filters, owner and acceptable latency. Then configure Shopify Analytics and connect only the external data required for those decisions.
Expect differences between Shopify, GA4, ad platforms, payment gateways and accounting. Their sessions, attribution windows, identities, time zones and revenue definitions differ. The objective is explainable reconciliation—not forcing every tool to show the same number.
Define the dashboard’s operating purpose
Separate executive, growth, merchandising, retention, operations and finance views. An executive weekly view should reveal revenue, margin, demand, conversion, customer mix and operational risk. A channel specialist needs campaign and funnel diagnostics. Finance needs settlements, refunds, fees, tax and ledger reconciliation.
For each audience, list the decisions made daily, weekly and monthly. Remove a metric if no one can name the action it informs. Add a drill-down path for every summary signal so the team can diagnose rather than debate.
Create a metric contract
A metric contract records name, plain-language definition, formula, source, event or table, grain, currency, time zone, attribution model, filters, update frequency, owner and known limitations. Version changes and note the effective date.
Define the business calendar
Choose the store reporting timezone, finance calendar, week start and comparison logic. Compare like-for-like trading days and annotate launches, promotions, stockouts, theme changes and tracking incidents.
Establish source ownership
Shopify
Use Shopify for orders, products, customers, discounts, refunds, fulfilment and the platform’s own sales and session definitions. Shopify’s Analytics dashboard provides configurable metric cards and links to detailed reports, with data generally updated quickly.
GA4
Use GA4 for website and app behaviour, event paths, audience analysis and landing-page diagnostics when implemented correctly. GA4 is affected by consent, blockers, identity, event configuration and attribution. It should not replace Shopify order records for operational revenue.
Advertising platforms
Use Meta, Google and other platforms to understand spend, impressions, clicks, delivery, creative and platform-attributed conversions. Their attribution is self-reported and can overlap. Do not add attributed revenue across platforms as if it were unique total revenue.
Payment gateways and bank
Use gateways and bank settlements for cash movement, fees, disputes, reserves and payout timing. A payout is not the same as sales because it nets different transactions and periods.
Accounting and ERP
Use the approved ledger or ERP for recognised revenue, cost, tax, liabilities and financial reporting. Agree how Shopify events map to accounting entries and how period-end adjustments are handled.
Understand Shopify sales metrics
Document gross sales, discounts, returns or sales reversals, net sales, shipping, taxes, duties and total sales using Shopify’s current field definitions. Shopify’s field reference describes net sales as gross sales minus discounts and sales reversals; do not rename it “profit.”
Separate orders from transactions and units. An order can have multiple payment events, refunds or fulfilments. A customer can place multiple orders. Dashboard labels should preserve the grain.
Revenue view
Show gross sales, discounts, returns, net sales, shipping, tax, total sales and order count. Add a bridge from gross to net so leaders can see whether performance changed because of demand, promotion or returns.
Margin view
If product cost is reliable, show contribution after discounts, returns, cost of goods, payment fees, shipping subsidy and variable marketing cost. Clearly state which costs are provisional or excluded.
Refund and return view
Track refunded value, returned units, return rate, reason, product, cohort and time from order to return. Separate requested, received, approved and financially refunded states where systems support them.
Build the conversion funnel
A practical online-store funnel includes sessions, product views, add-to-cart sessions, checkout-reached sessions and completed orders. Shopify documents session-based funnel metrics, while GA4 uses its own event and session model. Do not combine numerator from one source with denominator from another.
Segment by device, landing page, market, customer type, source and product family. A blended conversion rate can hide a mobile failure or low-converting campaign traffic.
Instrument GA4 ecommerce
Implement the recommended ecommerce journey events that apply, such as viewing items, adding to cart, beginning checkout and purchasing. Include consistent item identifiers, currency and value. Google notes that event parameters add context used in reports and explorations.
Validate purchase events
Fire purchase only after confirmed completion and use a unique transaction identifier. Test duplicate prevention, refunds if implemented, consent states, cross-domain checkout, currencies and payment redirects. Compare daily transactions with Shopify.
Monitor data quality
Create checks for sudden event loss, duplicate purchases, impossible conversion rates, missing item IDs, direct-traffic spikes and unexplained source changes. Data incidents should appear as dashboard annotations.
Build acquisition and attribution views
Use consistent UTM governance for source, medium, campaign, content and term. Document casing and naming rules. Prevent internal links from carrying acquisition UTMs because they can overwrite journey context.
Shopify marketing reports support attribution views when sales metrics are combined with marketing dimensions. Its current documentation includes last non-direct and linear models in applicable reports, while other Shopify surfaces can use different models. Label the model next to the metric.
GA4 and ad platforms have their own attribution and identity rules. Create three distinct views: platform delivery, site-observed behaviour and Shopify-attributed sales. Reconcile directionally and investigate material gaps.
Channel economics
For each channel show spend, sessions or clicks, orders, new customers, Shopify-attributed sales, platform-attributed sales, contribution and payback where the data is credible. Do not call platform ROAS profit.
Incrementality
Attribution describes assigned credit, not necessarily causal lift. Use geo, holdout or controlled budget tests for high-stakes incrementality questions. Record test design and limitations.
Build merchandising views
Show product views, add-to-cart rate, checkout reach, units, net sales, discount, returns, gross margin, inventory, sell-through and stockout exposure by product, variant and collection.
Separate demand failure from availability failure. A high-view, low-add product may need proposition or page work; a high-converting product with no stock needs inventory action.
Product affinity
Use basket analysis to identify products purchased together, but validate merchandising logic and margin before bundling. Shopify reports can help reveal products bought in the same order depending on plan and report availability.
Launch tracking
Create launch cohorts and annotate product publication, price changes, creative, promotion and inventory arrivals. Compare against a defined baseline rather than the previous arbitrary period.
Build customer and retention views
Define new versus returning customer consistently. Track first order, repeat purchase, cohort retention, time to second order, repeat revenue, average order value, refunds and contribution by acquisition cohort.
Customer lifetime value is a model, not a universal field. State the horizon, revenue or margin basis, refund treatment, cohort maturity and prediction method. Do not compare immature cohorts with full-history customers.
Cohorts
Shopify’s reporting supports cohort analysis in applicable views. Use fixed acquisition cohorts and measure retained customers or value at standard intervals. Distinguish subscription renewals from discretionary repeat purchase.
CRM activation
Send only governed audiences to email, SMS or ad tools. Track suppression, consent, audience timestamp and campaign ID so activation can be audited back to the dashboard.
Build operations and fulfilment views
Track unfulfilled orders, ageing, time to fulfil, time to ship, delivery time, cancellations, stockouts and exceptions by location, carrier and market. Shopify’s overview can include fulfilment metrics and generated insights where eligibility applies.
Connect operational performance to customer outcomes: support contacts, refunds, reviews and repeat purchase. A faster dispatch metric has limited value if delivery exceptions increase.
Design the dashboard hierarchy
Executive page
Limit to the commercial scorecard: net sales, orders, contribution, conversion, new-customer mix, repeat performance, return rate, inventory risk and fulfilment risk. Show target, prior period and prior year where meaningful.
Diagnostic pages
Provide acquisition, funnel, product, customer, operations and finance tabs. Every executive metric should link to its diagnostic view with the same definition and filter context.
Annotations and commentary
Record launches, incidents, stockouts, promotions, price changes, tracking changes and external events. Shopify’s reports can display annotations for store events; maintain an additional decision log when needed.
Visual standards
Use line charts for trends, bars for comparisons, tables for precise investigation and waterfall views for revenue bridges. Avoid gauges, excessive colours and dual axes that obscure change. Show sample size and data freshness.
Reconciliation workflow
Daily, compare Shopify orders and net sales to the analytics purchase events and investigate tracking gaps. Compare payment status and gateway transactions to expected settlements. Weekly, reconcile advertising spend and campaign taxonomy. Monthly, bridge Shopify to the ledger.
Create an exception table with date, system, transaction or aggregate, variance, probable cause, owner, status and resolution. Set materiality thresholds so the team focuses on meaningful differences.
Common causes of discrepancies
Consent and blockers, timezone, currency conversion, order edits, refunds, attribution windows, cross-device identity, duplicate tags, internal traffic, test orders and data delays can all create gaps. Explain the cause before changing definitions.
Implementation roadmap
Week 1: requirements and definitions
Interview decision-makers, inventory sources, create the metric contract and approve source ownership, calendar and access.
Week 2: instrumentation audit
Test pixels, GA4 ecommerce, consent, UTMs, Shopify reports, gateway exports and accounting mappings. Quantify existing gaps.
Weeks 3–4: build the minimum dashboard
Create executive and three highest-value diagnostic views. Add data-quality controls and annotations. Validate against sample transactions.
Weeks 5–6: operationalise
Train owners, schedule reviews, document investigation paths and establish change control. Backfill only the history that is reliable and decision-relevant.
Ongoing
Review metric definitions quarterly, access monthly and tracking after theme, checkout, app, channel or consent changes. Retire unused dashboard elements.
Commercial recommendation
Use Shopify Analytics first for store-operating decisions and customise its dashboard and reports before buying another reporting tool. Add GA4 for behaviour, ad platforms for delivery and finance sources for reconciliation. Move to a warehouse or BI layer when multi-store, cross-channel, margin or custom-cohort requirements justify the complexity.
The dashboard should shorten the path from signal to owner and action. Measure whether weekly reporting time, unresolved variances and decision latency decrease after implementation.
Project Supply can define the measurement architecture, implement Shopify and GA4 tracking, build decision dashboards and automate reconciliation. Explore our AI and Data Analytics and Ecommerce Development services, or contact Project Supply to request an ecommerce analytics assessment.
FAQs
Web Personalisation
Framer is a design tool that allows you to design websites on a freeform canvas, and then publish them as websites with a single click.
UI and UX Design
Framer is a design tool that allows you to design websites on a freeform canvas, and then publish them as websites with a single click.
Search Engine Optimisation
Framer is a design tool that allows you to design websites on a freeform canvas, and then publish them as websites with a single click.
CRM and ERP Solutions
Framer is a design tool that allows you to design websites on a freeform canvas, and then publish them as websites with a single click.
Ecommerce
Framer is a design tool that allows you to design websites on a freeform canvas, and then publish them as websites with a single click.
Email Marketing
Framer is a design tool that allows you to design websites on a freeform canvas, and then publish them as websites with a single click.
Marketing Automation
Framer is a design tool that allows you to design websites on a freeform canvas, and then publish them as websites with a single click.
Chatbots and Conversational AI
Framer is a design tool that allows you to design websites on a freeform canvas, and then publish them as websites with a single click.
Chatbots and Conversational AI
Framer is a design tool that allows you to design websites on a freeform canvas, and then publish them as websites with a single click.
Related Blogs
We know your space
Explore our latest UI/UX Case Studies that showcase how our process-driven creativity transforms complex ideas into real, measurable business results, step by step.


