Shopify

D2C Contribution Margin by Channel: Which Sales Channel Is Actually Most Profitable

D2C Contribution Margin by Channel: Which Sales Channel Is Actually Most Profitable

Learn how to calculate D2C contribution margin by channel — and which channels actually deliver profit after fees, fulfillment, and acquisition costs are accounted for.

Learn how to calculate D2C contribution margin by channel — and which channels actually deliver profit after fees, fulfillment, and acquisition costs are accounted for.

08 min read

D2C Contribution Margin by Channel: Which Sales Channel Is Actually Most Profitable

Revenue is easy to celebrate. Contribution margin is harder to fake. If you are optimizing your omni-channel architecture by looking at blended ROAS or aggregate top-line revenue, you are making decisions with a deeply flawed map. Multiplying un-allocated customer acquisition costs across asymmetric sales corridors masks the structural margin erosion that occurs beneath the surface of your business. When a direct-to-consumer organization prioritizes top-line scaling volume over deep multi-period ledger and process reconciliations, it risks scaling unprofitable distribution layers that deplete working capital. Transforming your financial tracking systems requires a disciplined shift toward event-driven database audits that trace capital performance back to specific transaction moments. This analytical precision ensures that your growth investments systematically expand terminal enterprise value.

If you're running a D2C brand across multiple channels — your own Shopify store, Amazon, wholesale accounts, retail partnerships, social commerce — you already know that not every dollar of revenue costs the same to earn. What you may not know is exactly how much each channel is actually leaving in your pocket after every cost is accounted for. Forcing an unpolished value product through a high-cost direct conversion path can drain your performance marketing capital just as quickly as dropping a luxury item into a price-driven marketplace can ruin premium brand equity. Growth operators must evaluate these platforms not as simple software products, but as entirely distinct operating models that reshape your supply chain dependencies and customer retention strategies. Unifying your historical component costs, warehouse pick surcharges, and paid ad inflation trends into a clear financial ledger is the only way to protect your long-term pricing power and expand corporate profit pools predictably over multiple fiscal cycles.

D2C contribution margin by channel is the metric that answers that question cleanly. It strips out the noise and tells you what each channel genuinely contributes to your business after variable costs. This post gives you the framework to calculate it, the channel-by-channel breakdown to benchmark against, and the logic to make smarter allocation decisions. We will evaluate how to navigate local distribution loops, map out specific transactional capacities across read and write operational layers, and outline a clear readiness model to minimize cross-channel execution friction. Additionally, we will cover the common technical errors and positioning mistakes teams make during multi-channel expansions, compare these environments directly against legacy retail setups, and provide an actionable framework for auditing your store’s underlying data pipelines. By implementing the data-driven steps detailed in this deep dive, your engineering and operations teams can deploy a highly secure, conversion-optimized global commerce engine.

What Is Contribution Margin and Why Does It Matter for D2C Brands?

Contribution margin is the revenue remaining after all variable costs directly associated with a sale are subtracted. It is not gross margin. It is not EBITDA. It is the per-unit or per-channel measure of how much money is actually left to cover fixed costs and generate profit. By formalizing this baseline financial parameter, operations managers can easily identify which specific consumer segments, product mixes, and regional sales corridors are generating real profit rather than just hollow top-line transaction volume. This structural tracking strips away the vanity data points that hide margin leaks, allowing executive boards to calculate the exact cash flow velocity generated by separate buyer categories over time. Implementing this decoupled auditing strategy gives your finance team a clear baseline to protect long-term store equity.

The formula is straightforward:


$$Contribution\ Margin = Net\ Revenue - Variable\ Costs$$

For D2C brands, variable costs typically include:

  • Production Resource Outlays: Cost of goods sold (COGS), covering raw material procurement, manufacturing labor, and component variations.

  • Logistics Distribution Fees: Fulfillment and shipping costs, including warehouse pick-and-pack charges, dimensional weight freight vectors, and carrier adjustments.

  • Marketplace Commission Matrix: Platform fees or marketplace commissions, siphoning off margin through variable adjustments like peak-season storage surcharges.

  • Performance Acquisition Capital: Customer acquisition cost (CAC) or channel-specific paid media, factoring in dynamic ad bidding and creative testing budgets.

  • Financial Clearing Surcharges: Payment processing fees, encompassing gateway checkout rates, cross-border transaction spreads, and merchant account handling parameters.

  • Reverse Logistics Liabilities: Returns and refund costs, reflecting customer support resource allocations, warehouse inspection panels, and product restocking write-offs.

    What makes channel-level contribution margin powerful is that each channel carries a different cost structure. A sale on Amazon looks nothing like a sale through your owned Shopify store, even if the product and price are identical. Once you see the numbers side by side, it changes how you think about growth. This foundational classification transforms an unorganized transactional database into an insightful roadmap for business performance, proving that volume and quality are independent variables. When you identify that an isolated channel vintage is yielding exceptionally high repeat margins while a newer node is stalling out, you can stop wasting capital on underperforming traffic streams. Shifting to this granular methodology ensures that every dollar of growth capital is intentionally directed toward securing highly durable, margin-expanding consumer relationships.

The D2C Channel Contribution Margin Scorecard

This is Project Supply's working framework for comparing channel profitability on a like-for-like basis. Apply it to your own numbers — the structure matters more than the specific percentages, which vary by category, AOV, and fulfillment setup. Standardizing your cohort and channel evaluations against this structured scorecard removes subjective guesswork from your growth planning sessions, providing your executive board with a clear look at capital allocation efficiency.

How to Use the Scorecard

For each channel, calculate the following line items as a percentage of gross channel revenue:

  1. Gross Revenue: Total dollar amount generated by the sales channel before deductions.

  2. Net Revenue calculation: Subtract all processed customer returns and front-end markdown discounts from Gross Revenue.

  3. Gross Profit allocation: Deduct exact cost of goods sold (COGS) matrices from your Net Revenue figures.

  4. Fulfillment and shipping subtraction: Deduct all packaging materials, outbound carrier rates, and 3PL pick charges.

  5. Platform fees or commissions clearing: Deduct fixed marketplace percentage rates and ongoing administrative software fees.

  6. Payment processing optimization: Account for all gateway processing cuts, localized wallet costs, and multi-currency exchange fees.

  7. Channel-allocated marketing spend: Multiply CAC by units sold to capture the total performance media cost required to generate the volume.

  8. Channel Contribution Margin: The terminal financial remainder, expressing true bottom-line profitability for the channel asset.

    Run this for every active channel quarterly. Then rank channels by contribution margin percentage, not by revenue. The ranking almost always surprises brands. This operational scoring system allows data teams to categorize past cohorts clearly, helping managers instantly spot which seasonal marketing campaigns or promotional offers successfully generated profitable cohorts. It acts as an early warning system, helping your media buyers quickly identify when a newly scaled customer acquisition tactic is creating structurally fragile, unprofitable customer segments.

Channel-by-Channel Breakdown: What the Numbers Typically Look Like
Owned DTC (Shopify or Similar)

Your own storefront has the highest margin ceiling of any channel — and the widest variance. There are no marketplace commissions eating 8–15% of revenue. You own the customer relationship and the data. By establishing a completely brand-owned cloud architecture, your growth teams can deploy server-side tracking pixels, build granular customer cohort matrices, and pass first-party data strings directly to ad platforms to optimize lookalike targeting algorithms. This absolute data ownership gives your business the freedom to build personalized lifecycle marketing workflows, implement custom webhooks, and optimize average order values through targeted post-purchase cross-sells that lift long-term store equity.

The catch is that owned DTC contribution margin is directly tied to your CAC. A brand spending heavily on Meta and Google to drive traffic can easily burn through its margin advantage if acquisition efficiency declines. When CAC rises, owned DTC can become one of your most expensive channels. Many software platforms default to showing linear lifetime value curves that ignore variable product costs, dynamic shipping adjustments, and localized payment gateway processing fees. To protect bottom-line performance, finance and operations teams must look past basic retention charts and calculate the actual cash flow velocity generated by separate buyer segments over time. Mapping these underlying monetary patterns prevents brands from overfunding destructive conversion loops that show misleading early revenue spikes.

Typical variable cost structure on owned DTC:

  • Fulfillment allocation: 8–14% of revenue depending on AOV and 3PL setup complexity.

  • Payment processing processing: 2–3% depending on regional checkout payment method mixes.

  • Platform software overhead: 0.5–1% depending on core administrative plan tiers.

  • CAC-allocated marketing spend: 15–40%+ depending on channel maturity, creative testing velocity, and brand pull.

    Owned DTC rewards brands with strong organic acquisition, high LTV, and repeat purchase behavior. If you are buying every customer, the math tightens fast. When you optimize to the blend, you optimize for the average — which means you are likely continuing to fund the worst cohort behaviors while under-investing in the conditions that produced the best ones. This strategic misallocation can trap a scaling brand on a treadmill of continuous high-volume customer acquisition, burning through precious marketing reserves without ever building a self-sustaining base of repeat buyers. To break out of this cycle, growth operators must decouple their performance reports, running multi-dimensional queries that explicitly isolate the long-term contribution margins of individual channels.

Amazon (FBA or FBM)

Amazon is the most common channel where brands discover their revenue is not their profit. The gross revenue looks impressive. The contribution margin often does not. The marketplace’s unique access to aggregate supply chain logistics, product review trends, and precise conversion volumes provides their internal product lines with a massive, unfair competitive advantage. When the marketplace identifies a highly profitable, fast-moving SKU within your catalog, they possess the infrastructure to source, manufacture, and list a near-identical alternative, positioning it directly above your listing in organic search results while undercutting your retail pricing structure.

Amazon's cost stack is significant:

  • Referral fees mapping: 8–15% variable tax depending entirely on product category definitions.

  • FBA fulfillment variables: $3–$7+ per unit for standard-size physical product dimensions.

  • Storage fee penalties: High multi-tier surcharges accumulating heavily during Q4 peak seasons and aged inventory thresholds.

  • Amazon advertising blocks: Sponsored product ad spend requirements consuming 15–30% of channel revenue to protect listing visibility.

  • Marketplace returns drag: Elevated return rates driven by platform-agnostic, single-click conversion patterns.

    A product selling at $40 on Amazon can realistically have a contribution margin of 10–20% after all costs — or negative margins if advertising is aggressive and the category is competitive. The brands that maintain healthy Amazon margins tend to have strong organic rank, disciplined ad spend, and high-velocity SKUs that keep storage costs in check. This concentration of high-intent buyers changes the nature of product advertising from speculative interest targeting to highly efficient keyword capture. By positioning your SKUs directly in front of consumers searching with explicit buying terms, you bypass the friction of traditional awareness funnels, driving rapid inventory turns and immediate cash generation cycles.

    Amazon is a volume channel. It is not inherently a margin channel. This systemic competitive threat turns high-volume marketplace scaling into a dangerous game, where your own operational success actively accelerates the arrival of an existential, platform-backed competitor. If your product catalog has inconsistent tags, missing metadata, or duplicate SKUs, the marketplace algorithm will reflect those problems back at you, depressing organic placements. Prioritize a comprehensive data cleansing initiative and maintain absolute pricing parity logic across your digital channels to protect your marketplace account health from automated suppression penalties.

Wholesale (to Retailers)

Wholesale revenue often looks the worst on a gross margin basis because the selling price is typically 50% of MSRP. But the cost structure is also fundamentally different. Developing a bespoke wholesale matrix requires an executive team that is fully committed to continuous data auditing, clear margin transparency, and disciplined infrastructure investments. By establishing firm operational boundaries between your brand-owned channels and large retail partners, you protect your core unit economics while safely capturing broader market share without relying on expensive, short-term performance media buy-outs.

What wholesale removes from the equation:

  • Bulk Fulfillment Leverage: Individual fulfillment costs (you're shipping pallets, not individual parcels, minimizing pick fees).

  • Zero CAC parameters: Customer acquisition cost (the retail partner drives physical foot traffic to their storefronts).

  • Return Protection Layers: Low returns per unit (chargebacks and compliance adjustments are handled at a corporate contract level).

  • Processing Fee Elimination: Payment processing on individual consumer transactions is completely removed from your ledger.

    What wholesale adds:

  • Extended Capital Latency: Longer payment terms (net 30–60, sometimes net 90), stretching internal cash conversion cycles.

  • Compliance Matrix Friction: Complex retailer compliance requirements including EDI configurations, explicit labeling, and strict routing guides.

  • Chargeback Risk Vectors: Severe deductions and operational chargebacks for minor shipping or packaging rule breaks.

  • Forecasting Complexity Nodes: High minimum order quantity requirements that lock up raw production assets for months.

    For brands with strong manufacturing relationships and efficient logistics, wholesale contribution margin can be surprisingly competitive with Amazon — particularly because CAC is effectively zero per sale. The risk is in cash flow timing and retailer dependency. Shifting your supply chain over to a third-party retail network requires absolute compliance with rigid operational standards. A single sorting error or a minor documentation discrepancy can result in immediate inbound shipments being rejected, heavy non-compliance chargebacks, or your entire inventory remaining frozen inside retail distribution hubs for weeks without recourse, entirely paralyzing your capital flexibility.

Retail (Owned or Pop-Up)

For most D2C brands, owned retail is not a margin play — it is a brand and customer experience play. The fixed cost burden (rent, staff, buildout) makes retail contribution margin analysis more complex because you are mixing variable and semi-fixed costs. This absolute creative freedom enables premium brands to construct immersive digital and physical experiences that justify high average order values and separate their catalog from generic marketplace listings. Turning a basic transaction into an emotional consumer connection builds long-term brand equity that protects your pricing power across all downstream digital commerce portals.

If you are evaluating retail, treat it separately: run a fully-loaded unit economics model per location rather than folding it into your channel contribution margin scorecard. The question to answer is whether the customer acquisition and brand value generated justifies the cost structure — not whether it competes with Amazon on a per-order basis. The erosion of brand exclusivity and the inability to control the surrounding contextual environment can cause permanent damage to a luxury product's perceived market value. Treat physical installations as high-value media assets that generate first-party community data, rather than pure transaction lanes.

Social Commerce (TikTok Shop, Instagram Checkout)

Social commerce is the newest variable in most D2C channel mixes. The commission structures are still competitive (TikTok Shop has been aggressive with low fees to acquire GMV), but the creator economics — affiliate commissions, gifting, and seeding costs — need to be included in your contribution margin calculation. This social-commerce delivery engine leverages localized networks and trusted creator recommendations to move massive volume rapidly. However, because the platforms prioritize dynamic engagement loops over direct data handshakes, your backend systems must use robust server-side tracking configurations to capture incoming buyer variables accurately.

Do not evaluate social commerce channels purely on platform fees. Account for:

  • Creator Commission Taxes: Affiliate commissions consuming 10–20% of GMV across active creator networks.

  • Seeding Asset Depletions: Product gifting and seeding costs, which must be accounted for as a variable product expense.

  • Logistics Pipeline Friction: Incremental fulfillment complexity and fast-turn stock delivery requirements.

  • Impulse Return Spikes: Elevated return rates driven entirely by rapid, friction-free mobile checkout behaviors.

    Social commerce can deliver excellent margin if you have strong organic creator pull and low affiliate commission rates. It becomes expensive when every sale depends on paid creator activations at scale. If your product catalog features inconsistent metadata or unpolished descriptions, mobile conversion velocities will quickly drop. Growth teams must design highly customized video-friendly product landing templates to ensure that impulse traffic converts into larger average order values that can easily absorb affiliate payouts.

Common Mistakes in Channel Margin Analysis
  • Monolithic Revenue Prioritization: Comparing channels on gross revenue alone, mistakenly favoring high-volume, discount-heavy distribution zones that quietly create operational losses.

  • Ad Attribution Isolation Omissions: Forgetting to allocate marketing spend to the channel it drove, hiding high-cost marketplace ad spend inside a generalized global P&L line.

  • Return Rate Grouping Errors: Ignoring return rates by channel, overlooking the reality that marketplace returns run significantly higher than direct brand-owned checkouts.

  • Blended CAC Distortions: Using blended CAC parameters, which obscures poor ad account performance and misguides media buyers during key scaling choices.

  • Compliance Chargeback Oversight: Treating wholesale deductions as a surprise, failing to model recurring retailer penalties directly into expected contribution margins.

  • Isolated Channel Optimization: Optimizing for the highest-margin channel in isolation, ignoring how channel diversification, brand presence, and multi-market availability lift global equity.

    Systematically resolving these analytical mistakes prevents data corruption and keeps your operations team focused on high-value optimization opportunities. By layering explicit component costs directly into your reporting tools, tracking custom channels by exact entry traffic sources, and monitoring multi-month fulfillment variations closely, you protect your margin projections. Guarding your data systems with disciplined administrative oversight ensures that every growth campaign is backed by clean, highly accurate financial models.

How to Use Channel Contribution Margin to Make Allocation Decisions

Once you have clean contribution margin numbers by channel, the decision framework becomes clearer.

Grow

Grow the channel if: CM% is above your target threshold, the channel is not yet at capacity, and incremental spend produces predictable returns. This data signal indicates that your tracking infrastructure, creative testing assets, and carrier pipelines are operating at peak efficiency, making budget expansion a low-risk strategy.

Optimize

Optimize before growing if: The channel is revenue-significant but CM% is below target. Understand the cost drivers before adding budget. Review whether high acquisition costs, excessive storage penalties, or heavy payment conversion spreads are draining your margins, and run targeted optimization sprints to fix the leak before scaling.

Maintain

Maintain but don't scale if: The channel serves a strategic purpose (brand presence, retail credibility) but doesn't win on margin. Cap spend and protect it without treating it as a growth lever. This choice acknowledges that certain distribution layers exist purely to drive omni-channel validation rather than bottom-line cash generation.

Exit

Exit or renegotiate if: The channel consistently produces negative or near-zero contribution margin with no clear path to improvement. This is more common than most brands admit, particularly with underperforming wholesale accounts. Having the operational discipline to cut loose margin draining contracts frees up valuable working capital for your high-performing channels.

The goal is not to have one perfect channel. The goal is to understand what each channel is actually costing you so you can allocate resources deliberately. Designing your business around these localized market performance variables allows your brand to absorb operational shocks without sacrificing global catalog consistency. It empowers your merchandising team to craft promotions that fit your true unit economics, turning a basic multi-channel layout into a highly targeted, margin-optimized international distribution engine.

FAQ

What is contribution margin in D2C ecommerce?

Contribution margin in D2C ecommerce is the revenue remaining after all variable costs tied to a sale are subtracted — including COGS, fulfillment, platform fees, payment processing, and customer acquisition costs. It differs from gross margin because it accounts for channel-specific costs that gross margin calculations typically ignore. express it as both a dollar figure and a percentage of net revenue so channels with different revenue scales are comparable.

Which D2C sales channel typically has the highest contribution margin?

Owned DTC (through a brand's own website) has the highest potential contribution margin because there are no marketplace commissions. However, achieving that potential depends heavily on customer acquisition efficiency. Brands with strong organic traffic, repeat purchase rates, and word-of-mouth can see contribution margins of 30–50%+ on owned DTC. Brands relying on paid acquisition to drive every order often see margins much closer to, or below, their Amazon numbers.

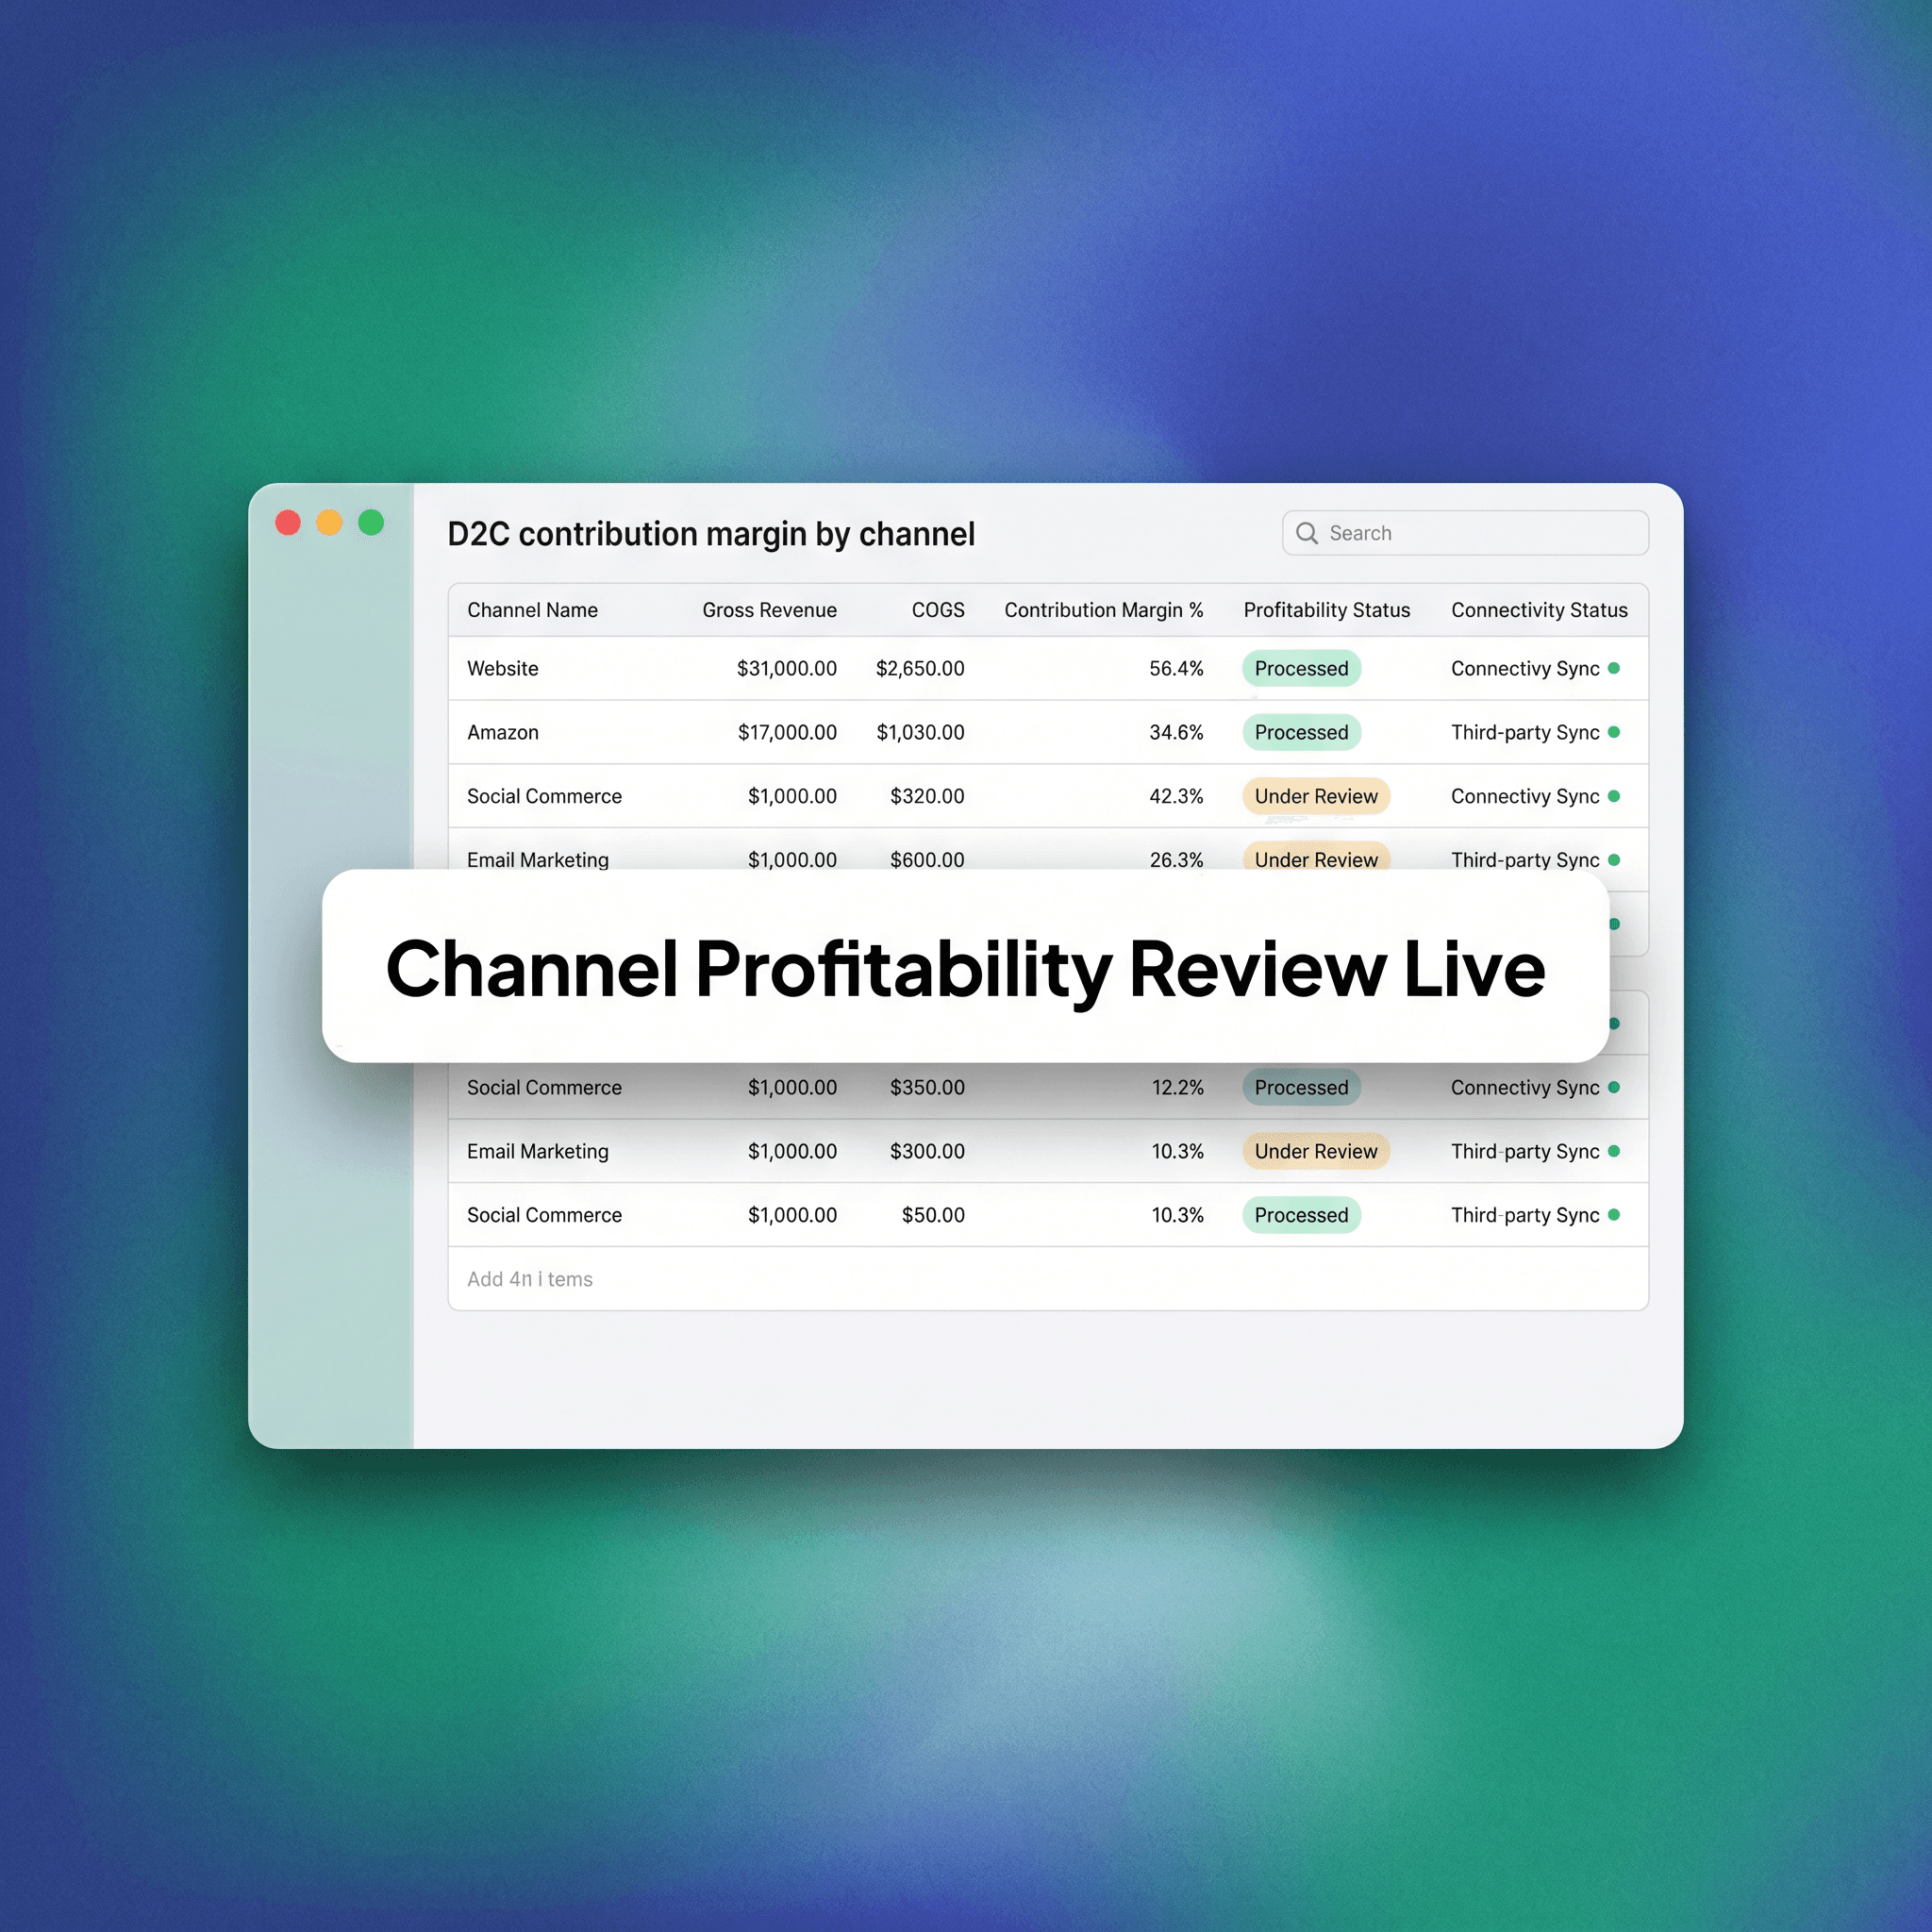
How do I calculate contribution margin by channel?

Start with gross channel revenue, subtract returns and discounts to get net revenue, then subtract COGS, fulfillment costs, platform or marketplace fees, payment processing fees, and the marketing spend attributable to that channel. The result is your channel contribution margin. EXPRESS it as both a dollar figure and a percentage of net revenue so channels with different revenue scales are comparable, enabling clean cross-channel audits.

Is Amazon a profitable channel for D2C brands?

Amazon can be profitable, but the cost structure is demanding. Between referral fees (8–15%), FBA fulfillment fees, storage costs, and rising advertising spend requirements, many brands find their Amazon contribution margin is lower than expected. Brands that maintain profitability on Amazon typically have strong organic rank, high-velocity products, and disciplined advertising efficiency (ACOS/TACOS targets that align with their margin structure).

Should I include customer acquisition cost in contribution margin calculations?

Yes, for most meaningful analysis you should. If you exclude CAC, you get a contribution margin that tells you how profitable an order is in isolation — which is useful for operational decisions. If you include channel-allocated CAC, you get a margin figure that reflects the true cost of generating that sale, which is what matters for investment and growth decisions. Use both, but be clear about which version you're looking at and why.

How often should D2C brands run a contribution margin analysis by channel?

Quarterly is the minimum cadence for most brands. For brands that are actively scaling, testing new channels, or seeing margin pressure, monthly analysis creates a tighter feedback loop. Channel economics shift as you scale — advertising costs change, fulfillment rates renegotiate, and platform fee structures update — so a contribution margin snapshot from six months ago may not reflect your current reality.

What is a good contribution margin percentage for a D2C brand?

A healthy contribution margin benchmark varies by category, price point, and business model, but most D2C operators target 30–50%+ on a blended basis after variable costs. Businesses with low AOV, high return rates, or expensive fulfillment often operate in the 15–25% range and rely on repeat purchase frequency to make the unit economics work. The right number for your brand depends on your fixed cost structure and what margin you need to cover overhead and generate profit.

DIRECT QUESTIONS:

What specific server-side technical limitations prevent Shopify stores from passing full multi-touch attribution data directly to Meta Ads Manager without an standard CAPI configuration?

Without a properly implemented Conversion API (CAPI) server-side integration, Shopify stores rely entirely on client-side browser tracking scripts, which are severely blocked by browser privacy mechanisms like Apple's App Tracking Typography framework and Intelligent Tracking Prevention. These client-side protocols frequently drop or block third-party tracking cookies, strip URL parameters, and terminate script execution, preventing the transmission of critical match keys such as external IDs, phone numbers, and email addresses. Consequently, when a customer moves across multiple devices or experiences a delayed purchase cycle, browser-based tracking fails to link the final conversion back to the original top-of-funnel ad interaction. A server-side CAPI integration bypasses browser limitations by transmitting transaction event payloads directly from Shopify’s cloud infrastructure to Meta's servers, ensuring precise historical click-ID matching and eliminating the data attribution gaps that artificially inflate reported customer acquisition costs.

How do Amazon's multi-tier FBA storage fees affect the capitalized inventory costs of a D2C brand experiencing high product seasonality?

Amazon enforces an intricate, multi-tier FBA inventory fee framework that includes base monthly storage fees, aged inventory surcharges, and utilization multipliers that heavily penalize brands with low inventory turnover during off-peak and peak seasons. During Q4, base storage fees can spike by more than 200% per cubic foot, significantly increasing the holding costs of oversized or slow-moving items. Furthermore, if a brand carries inventory that exceeds a 181-day threshold inside Amazon's fulfillment centers, they face steep aged inventory surcharges that accumulate monthly. For highly seasonal D2C brands, this cost layout rapidly inflates capitalized inventory carrying costs on the balance sheet, forcing finance teams to choose between aggressive, margin-negative liquidations on the marketplace or facing severe capital drainage through recurring warehousing penalties that shrink overall net operating income.

What precise architectural steps must an engineer execute to configure an external headless frontend that dynamically syncs checkout state with Shopify's Storefront API?

To construct a headless commerce frontend that connects with Shopify's backend, an engineer must first provision an authenticated public access token via the Shopify admin panel under the Storefront API configuration settings. The frontend application, typically built on a framework like Next.js or Remix, must use GraphQL queries to pull product schema catalogs and manage local cart states through client-side state hooks. When a user initiates a checkout action, the frontend application triggers the checkoutCreate or cartCreate mutation via the Storefront API, passing the local line item arrays, variant IDs, and quantities to generate a unique, secure checkout URL on Shopify’s primary domain. The application then performs a secure client-side redirect to this generated URL, passing checkout state variables and tracking parameters seamlessly to hand over final payment processing and order compliance tasks to Shopify's high-throughput infrastructure.

How does Amazon's Buy Box algorithm penalize a brand that runs a temporary markdown promotion exclusively on its direct Shopify store?

Amazon utilizes automated external web-scraping engines that continuously monitor competing e-commerce platforms, including independent brand-owned Shopify storefronts, to ensure pricing parity across the internet. If Amazon’s scraping tool detects that a product listed on your Shopify store is priced lower than its corresponding ASIN on the marketplace, the platform's Buy Box algorithm will instantly penalize your listing by suppressing the "Add to Cart" and "Buy Now" buttons. This suppression strips your listing of its direct purchase shortcuts, forcing consumers to navigate through a multi-step "See All Buying Options" menu, which typically decimates immediate conversion rates by 70% or more. Additionally, sustained price disparity can trigger a downward adjustment in your account's organic search visibility, effectively choking off marketplace traffic until you manually adjust pricing parity or configure automated repricing scripts to mirror direct storefront discounts.

What specific data synchronization conflicts emerge when an enterprise middleware system attempts to reconcile Shopify's order status tags with Amazon's item-shipped webhooks?

Data reconciliation conflicts arise because Shopify and Amazon utilize completely different order state definitions, database schemas, and data transmission cadences within their transaction pipelines. Shopify processes orders at a holistic document level, relying on flexible, unstructured order status tags and fulfillment indicators that can be mutated asynchronously by external apps or customer service teams. Amazon, conversely, operates on a rigid, line-item-centric structural model where tracking identifiers and shipping confirmations must be bound directly to specific SKU instances within precise API submission windows to maintain compliance. When middleware attempts to reconcile these systems, conflicts occur if a multi-item order is partially fulfilled; Shopify may mark the master order object as "Partially Fulfilled" with custom operational tags, while Amazon fires individual item-shipped webhooks that require immediate, structured tracking attachments to prevent account health downgrades, frequently leading to race conditions and duplicate shipping logs.

How can an advanced e-commerce operator configure Cloudflare Workers to dynamically route traffic between a Shopify storefront and an Amazon landing page based on localized user geo-IP data?

An advanced operator can deploy a Cloudflare Worker at the edge of their domain infrastructure to intercept incoming HTTP requests and inspect the cf.country or cf.region geographic metadata headers provided by Cloudflare’s localized edge routing network. The developer writes a custom JavaScript script within the Worker that evaluates the user's incoming geo-IP data against a predefined corporate routing matrix; for example, traffic originating from countries with complex localized logistics networks could be automatically targeted for marketplace routing. The Worker then modifies the request path, executing a transparent server-side fetch or an immediate 302 redirect string to point the browser directly to the brand's Amazon store URL or localized ASIN landing page. By processing this structural logic entirely at the edge node, the brand completely eliminates application server processing delays, delivering ultra-fast, localized channel split routing without introducing front-end layout shifts or slow client-side redirect scripts.

What exact programmatic steps are required to map a custom Shopify metafield object into a structured Amazon Listing Feed using a standardized XML payload?

To translate a proprietary Shopify metafield matrix into a valid Amazon Listing Feed, an extraction script must first call the Shopify Admin GraphQL API using the metafields query to pull raw namespace and key-value attributes associated with a specific product ID. The integration middleware must parse this retrieved JSON response, map the custom value inputs against Amazon’s strict, category-specific XSD validation schemas, and construct a highly precise XML product feed payload. This payload must explicitly map the Shopify metadata into Amazon-defined XML tags, such as <ProductData> or <DescriptionData>, ensuring complete compliance with string lengths, allowed enum sets, and decimal requirements. Once the XML feed document is fully compiled, the script utilizes Amazon's Selling Partner API (SP-API) to execute a secure createFeed mutation, uploading the serialized XML payload to an authorized AWS S3 bucket and initiating a processing sequence that updates the marketplace catalog without corrupting data fields.

get in touch

Go from online presence to real business impact

Strategy, execution, and digital experiences designed to move together. Fill out the form below and our team will contact you shortly.

get in touch

Go from online presence to real business impact

Strategy, execution, and digital experiences designed to move together. Fill out the form below and our team will contact you shortly.

get in touch

Go from online presence to real business impact

Strategy, execution, and digital experiences designed to move together. Fill out the form below and our team will contact you shortly.

© 2026 projectsupply

Part of Tangle

© 2026 projectsupply

Part of Tangle

© 2026 projectsupply

Part of Tangle